Sentiment 4 — voices you can read at a glance
Lane M30 · 23 September 2026 · branch hub/sentiment-4-20260923 · built from the release build b6913cb · nothing deployed, nothing pushed.
1 · One measuring stick
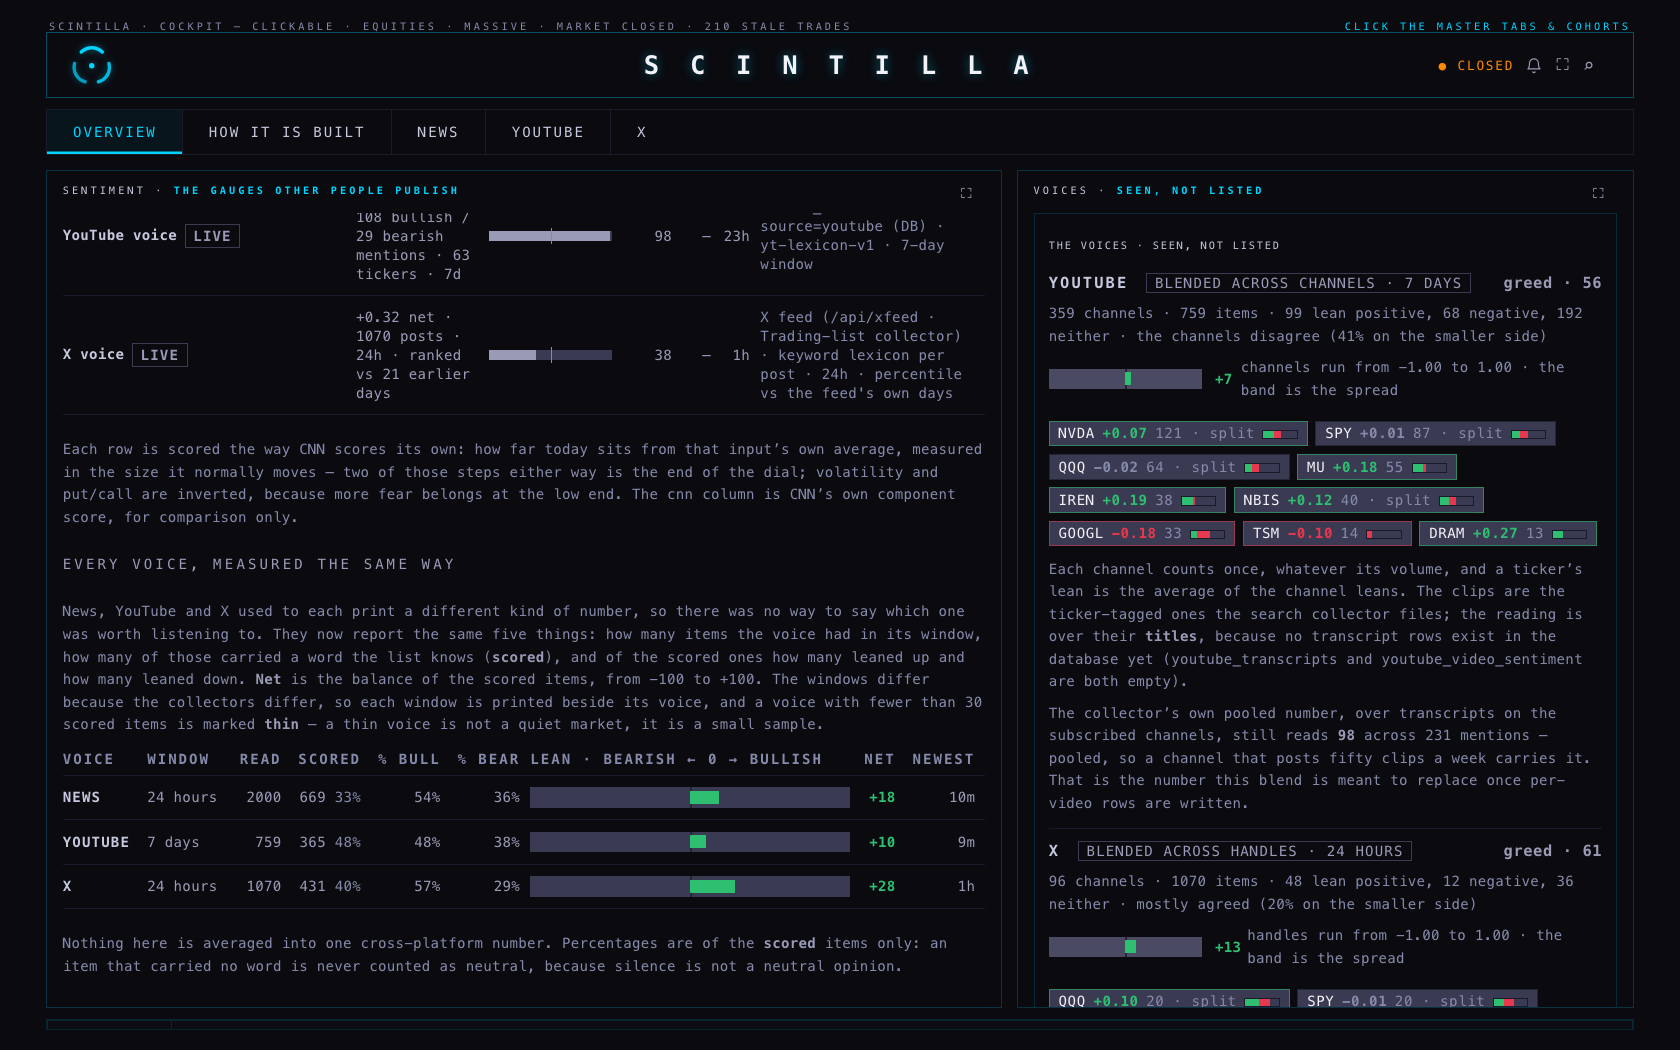
You said: “News: 31 scored, 21 up, 7 down — it’s very inconsistent the way you’re measuring across platforms.” Every voice now answers the same questions:
- read — how many items the voice actually had in its window;
- scored — how many of those carried a word the list knows (and what share of the read that is);
- % bull / % bear — of the scored items only, never of everything read;
- net — the balance of the scored items, from −100 to +100;
- window and newest — because a 7-day voice and a 24-hour voice are not the same thing.
This is what it printed when the screenshot was taken (23 Sep, 23:2xZ):
| voice | window | read | scored | % bull | % bear | net | newest |
|---|---|---|---|---|---|---|---|
| NEWS | 24 hours | 2,000 | 669 · 33% | 54% | 36% | +18 | 8m |
| YOUTUBE | 7 days | 745 | 359 · 48% | 49% | 38% | +11 | 3h |
| X | 24 hours | 1,071 | 431 · 40% | 57% | 29% | +28 | 1h |
Read that way: X is the most bullish voice today and the freshest; news is the widest but only a third of its headlines carry a scoring word; YouTube is a week-long view, so it moves slowest. A voice with fewer than 30 scored items is marked thin on the page — a thin voice is a small sample, not a quiet market.
2 · Voices, seen instead of listed
You said the blended table was “a data dump… very not nice to see”. It is now a picture: each voice gets a lean bar with a grey band showing how far apart the channels behind it actually are, and each ticker is a chip — colour is its lean, the number beside it is how many channels or handles carried it, and the tiny two-colour bar is the split inside it.
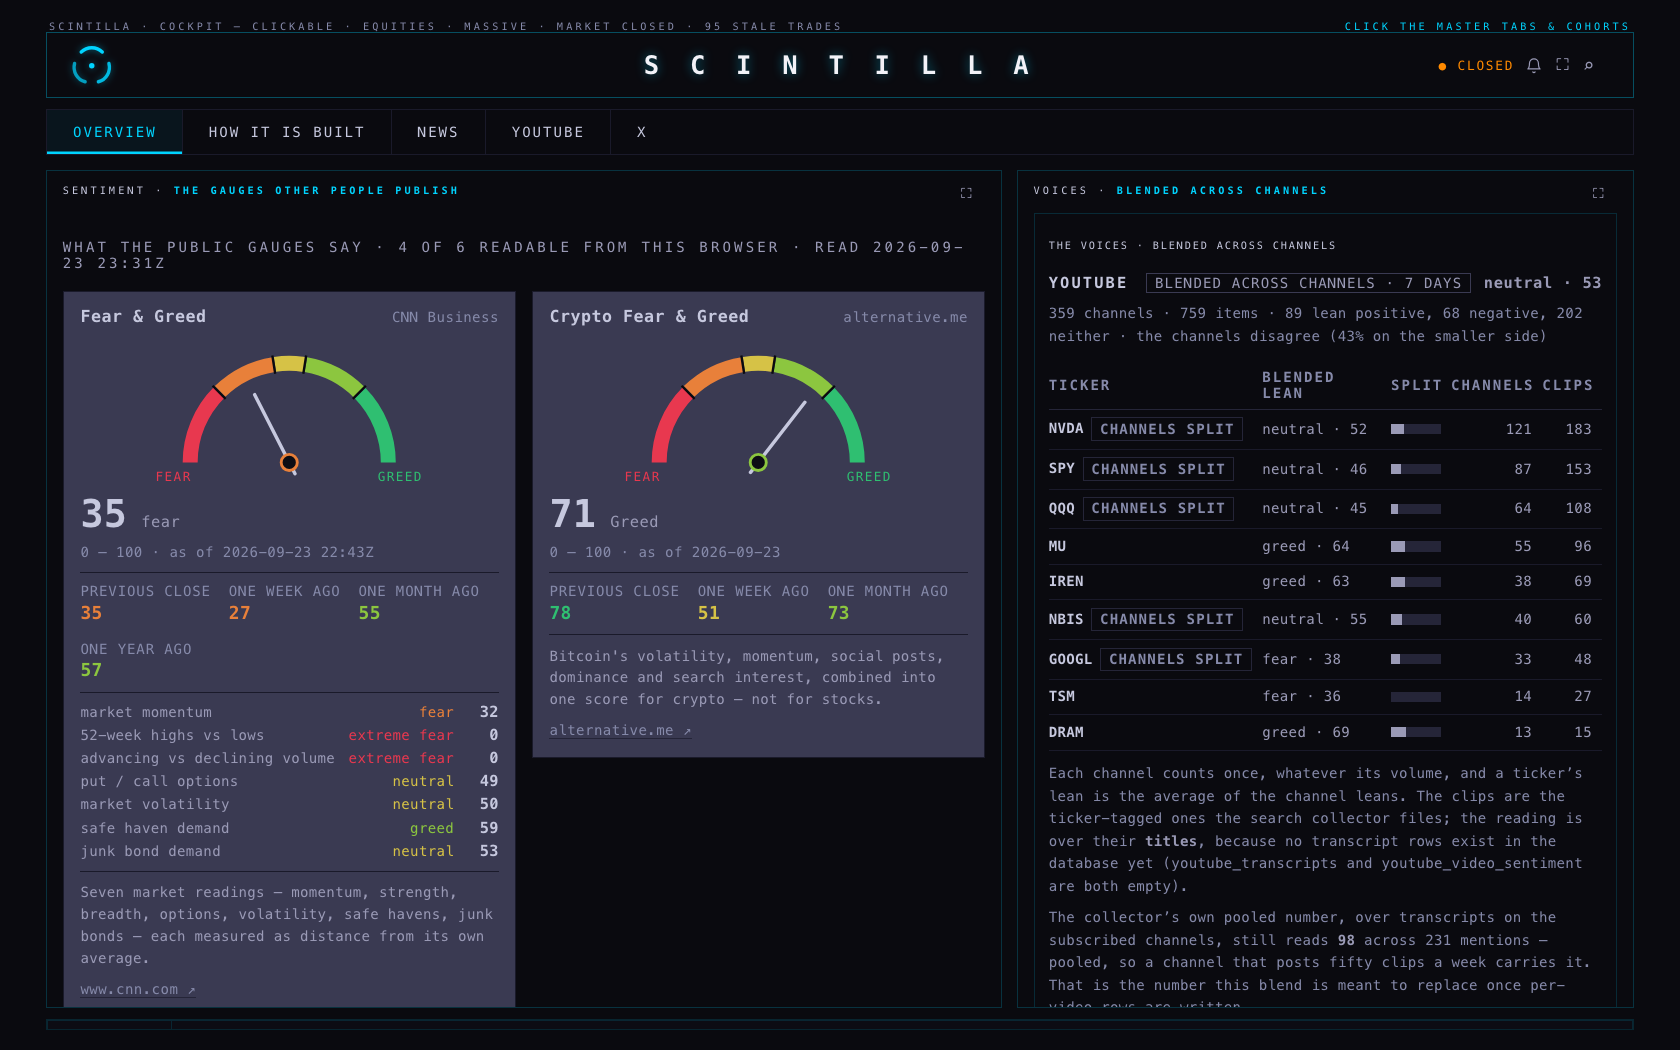
b6913cb): a table of TICKER / BLENDED LEAN / SPLIT / CHANNELS / CLIPS.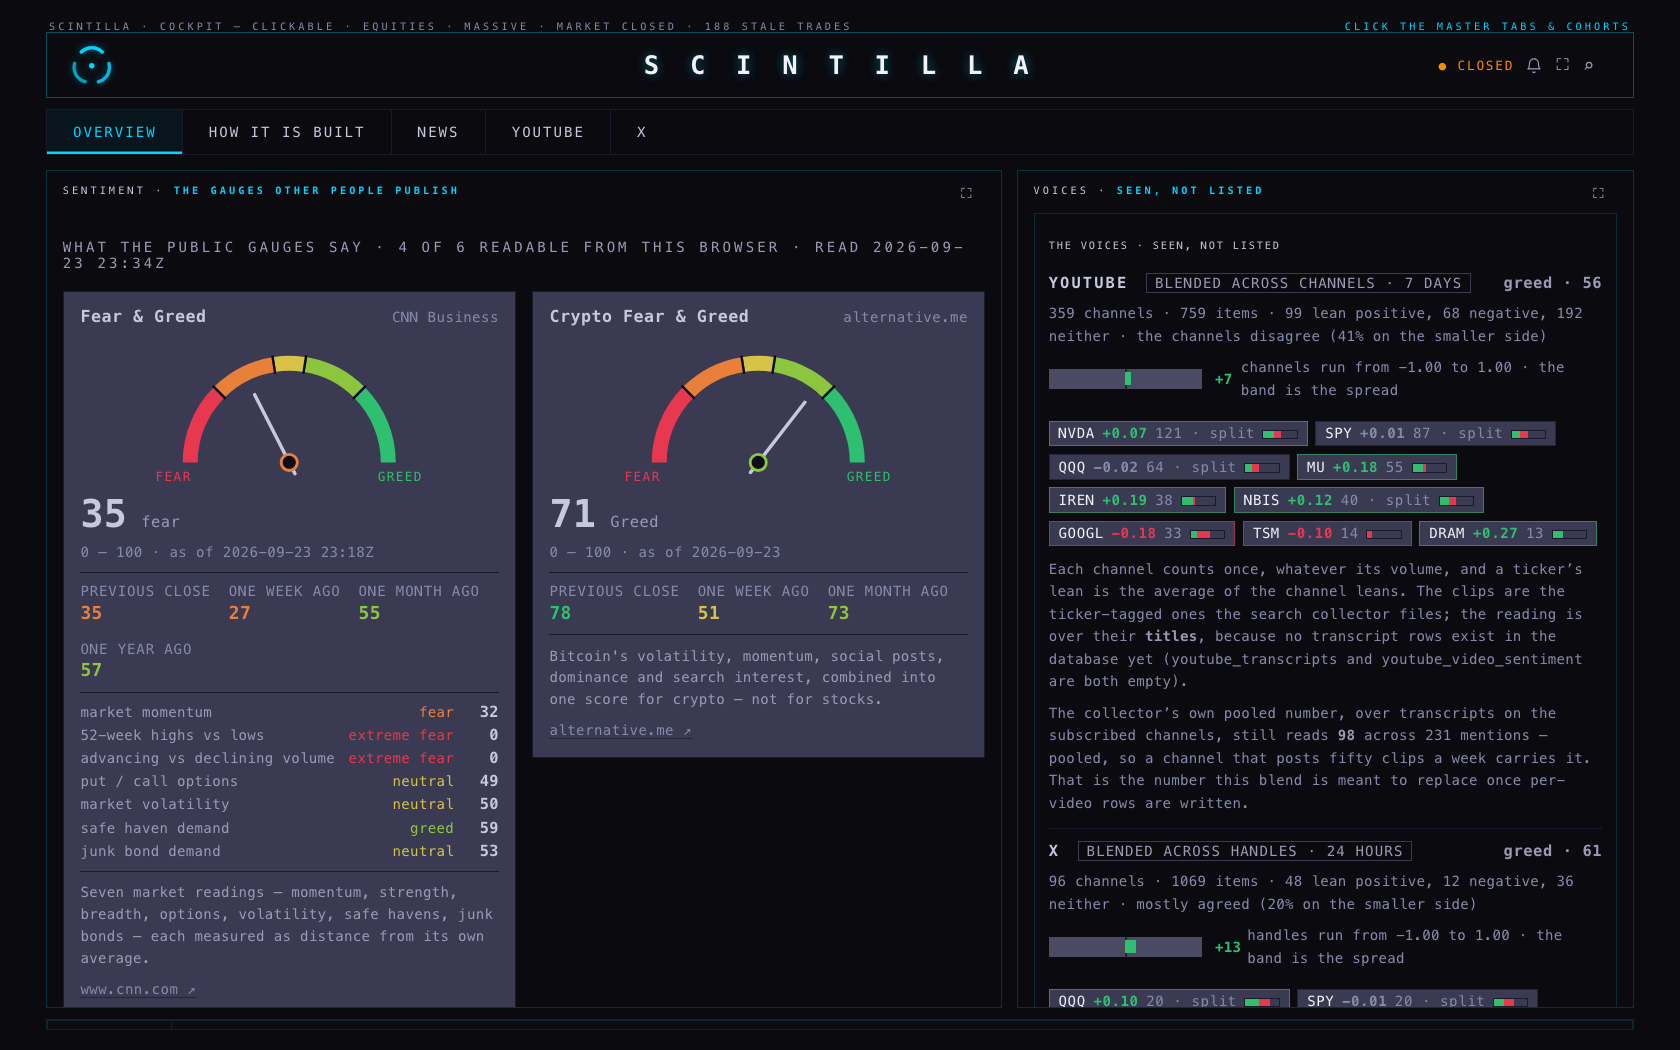
3 · Keywords, with their ticker
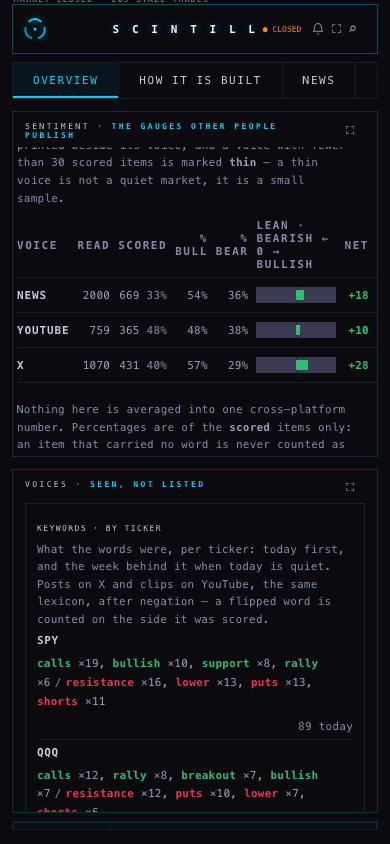
You asked for “a keyword tracker associated to a ticker that was mentioned with”. The rail now carries KEYWORDS · BY TICKER: today first, the week behind it when today is quiet. From the same screenshot:
QQQ — calls ×12, rally ×8, breakout ×7, bullish ×7 / resistance ×12, puts ×10, lower ×7, shorts ×6 · 80 today
NVDA — buy ×5, breakout ×3, higher ×3, ath ×2 / lower ×5, bearish ×3 · 44 today
The words come from X posts (by their $TAG) and YouTube clips (by their ticker column), counted after negation, so a flipped “bullish” is counted on the bearish side — the same rule the score itself uses. News headlines are not in this card, and the page says so: the stored news rows keep the score and the counts, not the headline text, so their words cannot be named per ticker yet.
4 · The language people actually use
The old list was plain English — “bullish”, “crash”, “upgrade”. The people on these channels do not talk like that. Version sc-social-v2 keeps every old word exactly as it was (so no old number moves for an invisible reason) and adds 62 entries: slang, abbreviations, two- and three-word phrases, and emoji. Every entry carries its polarity and a note saying why it is on the list, printed on the HOW IT IS BUILT page so you can argue with it.
| entry | kind | reads as | why it is there |
|---|---|---|---|
| calls printing | phrase | bullish | upside options making money — the clearest bullish phrase in this language |
| puts printing | phrase | bearish | bearish, although it contains “printing” |
| buy the dip | phrase | bullish | bullish even though it contains a fall |
| short squeeze | phrase | bullish | the words apart would read bearish |
| dead cat bounce | phrase | bearish | a bounce the speaker does not believe |
| rekt · bagholder · ngmi | slang | bearish | wrecked; stuck holding a loser; not gonna make it |
| LFG · tendies · printing | slang | bullish | excitement; profits; a position making money now |
| 🚀 🐂 📈 💎 🔥 | emoji | bullish | the most common marks in this feed — the old scanner threw them away with the punctuation |
| 🐻 📉 💀 🩸 😭 | emoji | bearish | the same, on the other side |
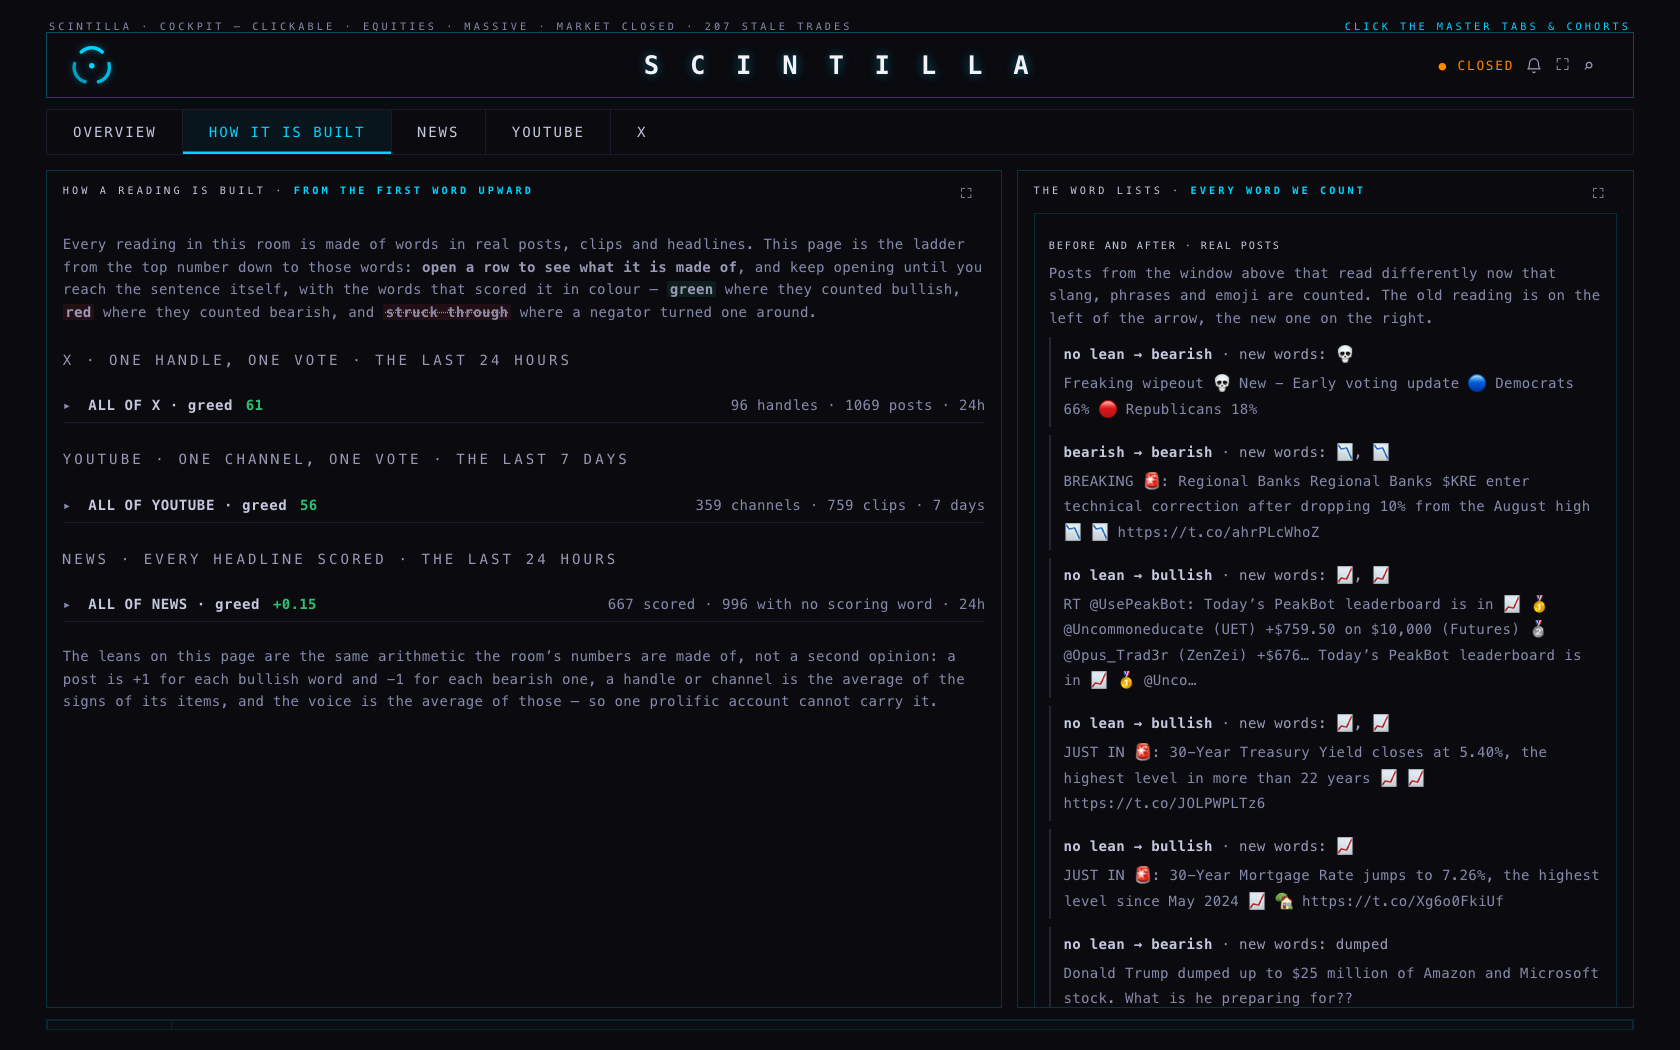
- “Freaking wipeout 💀 New — Early voting update 🔵 Democrats 66% 🔴 Republicans 18%” — now reads bearish. It is a politics post, not a market opinion.
- “30-Year Treasury Yield closes at 5.40%, the highest level in more than 22 years 📈 📈” — now reads bullish. A rising yield is not a bullish stock signal; the emoji only means “this number went up”.
- The other two are right: a $KRE technical-correction post reads bearish, and a leaderboard-of-gains post reads bullish.
A phrase is matched before its single words, so “buy the dip” is one bullish reading, not a “buy” beside a “dip”, and “puts printing” is bearish rather than a bullish “printing”. The HOW IT IS BUILT page also carries a BEFORE AND AFTER · REAL POSTS card: posts from the window on screen that read differently now, with the new words named. If nothing changed in that window, it says that instead of hiding it.
5 · Breadth — the whole list, not the index
You said: “This rally was really low breadth — we need to start considering market breadth more in our mix.” There are now four breadth readings, each on its own row with its own source and age, and none of them folded into a secret composite. Measured on session 2026-09-23 over all 364 names:
| reading | what it said | where it comes from |
|---|---|---|
| Equal weight vs the index | RSP − SPY over 20 days: −5.0 points — the average stock is well behind the index | chart API daily bars, live in the page |
| Above the 50-day average | 134 of 364 · 36.8% | measured snapshot, one daily series per name |
| Above the 200-day average | 190 of 361 · 52.6% | same snapshot |
| 52-week highs vs lows | 5 highs (ABBV, AMD, CRWD, DE, TMO) against 23 lows — 18% of the extremes are highs | same snapshot; today’s high or low against the 252 sessions before it |
Together with the older row — 105 of 363 names up on the day, 29% advancing — that is a plain statement of what you saw: the index can be held up by a handful of names while most of the list is below its own 50-day average.
How the snapshot works. Breadth needs a year of daily bars for every name, which is 364 requests — far too much for a page load. scripts/breadth-snapshot.mjs reads them from the chart API (about 20 seconds, no other provider, nothing written to any price table) and writes data/breadth/latest.json plus a one-row-per-session history.json. The page reads that file and always prints when it was measured, so a stale reading looks stale instead of looking current. Today’s run is the first, so the history has one row; each later run adds one.
6 · Is the X feed current?
The brief said the collector’s heartbeat read “error” at 18:32Z. Here is what actually happened, from the collector’s own files on this MacBook:
- The 18:30 pass stalled: the list stopped paging without an end marker, and the pass’s “Pass finished” signal never appeared within 30 seconds. The run was kept — 15 chunks were saved — and the heartbeat recorded the error.
- The 20:30 and 22:30 passes ran and published normally. The 22:30 pass finished at 22:30:56Z with 97 posts observed and status
published. - The published feed is current: I fetched it myself. 17,351 posts, newest 2026-09-23T22:30:01Z — about an hour old at the time of the screenshots, inside the collector’s two-hour rhythm.
- The LaunchAgent
com.alanharvey.scintilla-xfeed-collectoris loaded, last exit code 0, with nine passes a day between 06:30 and 23:30 ET.
So there was nothing to fix in the collector, and I did not change it. What was missing was that the room never showed any of this, so a stalled pass was invisible until the numbers looked wrong. The rail now carries IS THE X FEED CURRENT? — the newest post, its age, how many posts fell in the window, how many carried a scoring word, and the collector’s schedule. If the newest post is more than four hours old it says the collector has probably missed a pass.
Where every number comes from
| number | source |
|---|---|
| News read / scored / bull / bear | the stored per-headline rows (or the same scoring done in the browser when the table is absent), Loughran-McDonald plus headline verbs, 24-hour window |
| YouTube read / scored / bull / bear | youtube_videos ticker-tagged clips, last 7 days, scored on their titles and descriptions |
| X read / scored / bull / bear | the collector’s published feed at /api/xfeed, posts from the last 24 hours |
| Ticker chips and their splits | the same items, one channel or handle = one vote, whatever its volume |
| Keywords per ticker | the same items again, words counted after negation, credited to every ticker the item mentioned |
| Breadth (50-day, 200-day, 52-week) | data/breadth/latest.json, measured from chart API daily bars by scripts/breadth-snapshot.mjs |
| RSP vs SPY | chart API daily bars, read live by the page |
| The published gauges (CNN, crypto, VIX, put/call) | unchanged from before this lane |
What could be wrong
- “Read” for news is capped at 2,000. The database hands out 1,000 rows at a time and the page reads two pages, so 2,000 is the ceiling, not necessarily the true number of headlines in 24 hours. The other two voices are true counts.
- Emoji fire on posts that are not about a stock at all — a politics post with 💀, a bond-yield post with 📈. Two of the four before/after examples tonight were wrong for that reason. The lexicon has no idea what the post is about; it only sees marks.
- A word list cannot hear irony, sarcasm or a hedge. Adding slang and emoji makes it hear more, not understand more. “🚀” in a joke counts the same as “🚀” in earnest.
- The new words move the numbers. That is the point, but it means a lean today is not directly comparable with a lean recorded before tonight. The version
sc-social-v2is printed on the page so the change has a name. - Emoji are counted but not highlighted in the word-by-word view — that highlighter still matches plain words only.
- Breadth is as fresh as its last run. Nothing schedules
breadth-snapshot.mjsyet, so if nobody runs it the page will keep showing an older session — clearly labelled, but older. - Our 364 names are not the market. The 52-week high/low count is ours, not the NYSE’s, and the page says so on the row. CNN’s equivalent uses the exchange count and weighs by volume.
- YouTube still reads titles, not transcripts, because no transcript rows exist yet. Unchanged by this lane, and still stated on the page.
What I did not do
- No deploy, no push, no merge. The branch is local.
- No database write of any kind, and no migration — the breadth snapshot is a file in the repo, not a table.
- I did not touch the collector, its LaunchAgent, its profile or its saved state; I only read its runtime files and the feed it publishes.
- I did not change the published gauges, the fear-and-greed scoring, the news lexicon file, or any room outside SENTIMENT.
prototypes/indicator-lab/is untouched. - I did not schedule the breadth snapshot, because scheduling is the coordinator’s call.
- I did not verify the room against the live site — the screenshots are a real browser against this branch, with the chart API and
/api/xfeedproxied through the production origin, because the API refuses a localhost origin.
Proof
Screenshots were taken in a real headless Chromium at 1680×1050 and 390×844, against this branch served from disk. The chart API only accepts https://scintillahub.ai as an origin, so both it and /api/xfeed were intercepted and re-issued from node with that origin header — that is the only thing relaxed; no page code was stubbed and no data was faked. 27 requests were proxied, none failed, and the page reported no script errors.
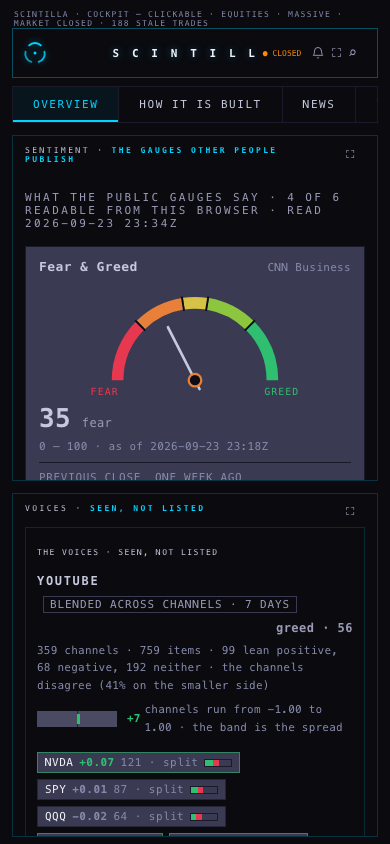
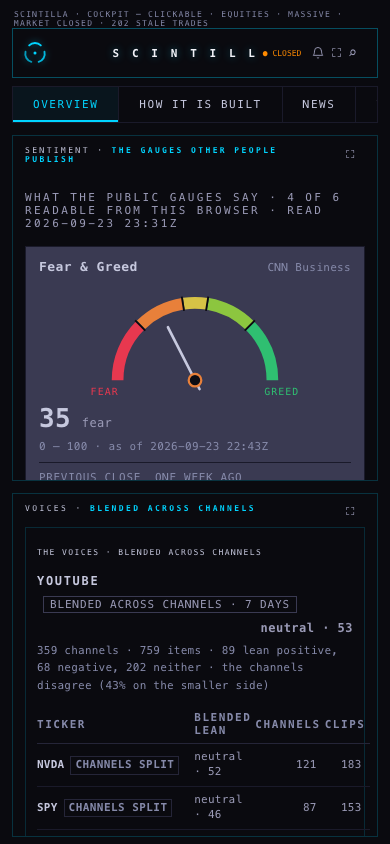
Tests: node --test tests/ — 468 tests, 464 pass, 2 fail, and both are the failures that were already failing on production before this lane (“every place this surface prints an age uses the one function” and xfeed-publish). The new file tests/sentiment-stick.test.mjs adds 10 tests covering the measuring stick, the phrases and emoji, the per-ticker keywords, the spread, and the breadth snapshot’s internal consistency.